Investors were happy to put 2022 in the rearview mirror, and for good reason. By year-end, the broad U.S. stock market was down 18% while bonds, the “steady Eddie” asset class, had fallen a record-breaking 14%. The pain was particularly pronounced for technology investors who had become accustomed to years of steadily rising share prices. From 2014 to 2021, the sector outperformed the broad U.S. market by an average of 8.6% a year. Rising interest rates and a related shift into slower growing Value stocks brought an end to the heady returns in 2022, when the sector fell 33%.
Many investors today are wondering if the tech stock sell-off represents a buying opportunity or the start of a prolonged period of underperformance. To help shed some light on this question, investment firm AllianceBernstein examined four previous periods when a market sector or style dominated returns. These “bubbles” included the 1970s “Nifty Fifty,” a period when investors favored a select group of growth stocks, the run-up in share prices prior to the 2000 Dotcom bust, the late 1970s Energy Crisis, and the 2007-2008 Financial Crisis. In two of these cases (the Financial Crisis and the Energy Crisis), strongly rising sector earnings largely drove the gains. In the other two (Nifty Fifty and the Dotcom bust), growing investor euphoria and higher valuations were behind the outperformance. In all four cases, the stocks of the sectors in question continued to underperform for three to four years after the sell-off. The sectors that did subsequently outperform were the market’s pervious laggards. If the market follows this same “reversion to the mean” behavior today, recent sector laggards such as energy, defense, healthcare services, and telecom may be poised to outperform.
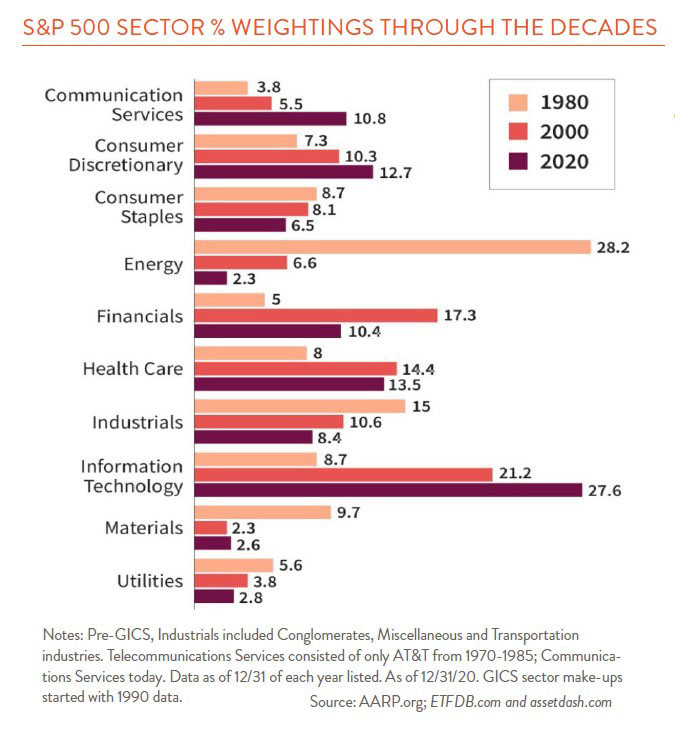
Structural changes in the economy also impact stock sector performance. Consider, for example, that the Dow Jones Industrial Average’s original 30 holdings were mostly related to commodity extraction and manufacturing, firms that were well positioned to feed the growing American economy. Over time, the U.S. economy has shifted more to services, and today, industrial and commodity-oriented firms make up at most 15% of the total market. As the chart below shows, the economy has shifted over time in other important ways. Thanks to an aging demographic, healthcare rose from 8% in 1980 to 14% in 2020. Financial services more than doubled from 5% to 10% over the same period of time, while energy, utilities, and materials fell as a share of the total. Technology, which represented only 9% of the S&P 500 in 1980, soared to 28% by 2020. The sector hit a high of 36% in late 2021 and now stands at 30%.

Given the growing importance of technology in the global economy, it is hard to imagine its share permanently retreating. But that does not mean that the future of today’s technology leaders is assured. First, technology stocks have historically underperformed during periods of slower economic growth and outperformed during expansions. Second, market share is hard to maintain in any part of the economy and especially so in the fast-paced world of technology. Consider that only one of the five largest technology companies by market capitalization back in 2005 (Microsoft) remains on the top five list today.
The technology sector will continue to play a dominant role in the U.S. economy and stock market. But shifting patterns within the sector are all but assured. Two decades ago, former hardware darlings like Hewlett-Packard and Dell ceded leadership to smart phone/cloud purveyors like Apple and Google. While it may take some time for the new leaders to emerge, new entrants will continue to fight their way onto the leaderboard.