As professional investors, we spend a lot of time thinking about how to best construct portfolios for our clients. These efforts focus on identifying the combination of assets (stocks, bonds, cash etc.) that will produce the maximum return for a desired level of risk. A whole body of research, based on vast quantities of historic risk and return data, supports our work. This research starts with two basic ideas. First, because the future is unknown, it makes sense to spread your assets across investments with different characteristics. This is the old “Don’t put all your eggs in one basket” idea. The second concept, which is less intuitive, holds that by combining assets whose returns don’t move in lock-step, you can actually produce better returns with less risk (i.e., volatility).
Portfolios that are well diversified both across and within asset classes will always have some components that are performing well and some that are not. As a result, the total portfolio’s performance will never be as good as the best performing component nor as bad as the worst. Diversification, in effect, smooths out returns.
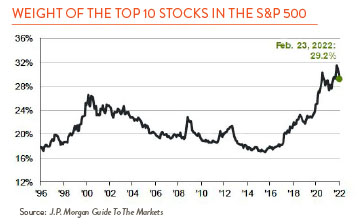
While diversification sounds like a good idea, it is not always easy to put into practice. The temptation for most investors is to dump poorly performing holdings and jump into those that are doing well. Take a look at the chart below. Between 2016 and 2022, the top 10 stocks in the S&P 500 rose from just over 16% of the total to 29%. This increase was not entirely unwarranted as the companies that make up the list (mostly large tech holdings like Google and Microsoft) were strong, growing businesses. But a momentum effect was also at work with more and more investors piling into the same shares simply because they were going up. While it would have been impossible to predict when exactly these shares would come back down to earth, their increasingly lofty valuations left them vulnerable for an upset. As of this writing, the shares of the companies that made the top 10 list are now down on average13% on a year-to-date basis.

So has diversification lived up to its promise during the most recent market decline? From January 1st to March 4th of this year, a portfolio totally invested in a broad U.S. stock market fund (ETF) – Portfolio A below — was down 10.0%. This portfolio has experienced a lot of volatility, as evidenced by its standard deviation of 16.4%. Portfolio B is 60% allocated to the same U.S. stock ETF but we added a 40% allocation of U.S. bonds to the mix. Not only did the bonds in Portfolio B help temper the weakness in stocks but they reduced the portfolio’s volatility by almost half. Adding more asset classes (real estate) and international exposure to the mix (Portfolio C) didn’t do much to improve the overall return but cut the level of volatility by another 20%. While drawing conclusions from such a short period is not advised, it is reassuring to see these recent results fall in line with the research covering much longer time periods.

Many “safe haven” assets are also serving their function this year. Gold, long considered a disaster hedge, is up over 10% while U.S. Treasuries are off in the 1% to 2% range. Within stocks, sectors with the least economic exposure, like utilities, are down marginally. While it is hard to hold some of these sleepier investments when markets are roaring, they earn their keep when prices go south. And what about Bitcoin? Cryptocurrencies have swung wildly this year but as of today are down 11%.