Somewhere in the second quarter, the economic narrative shifted to not if we were going to have a recession, but how deep and how long it might be. We decided to take a step back and look at how we got to this point and compare today’s outlook to similar periods in the past.
Over 2020-2022, the Federal Reserve expanded its balance sheet by buying over $3.1 trillion worth of Treasuries and Mortgage-Backed Securities. This latest round of “Quantitative Easing” was designed to hold down interest rates and keep the economy afloat during the pandemic-induced downturn. On the fiscal side, stimulus bills approved by Congress beginning in 2020 unleashed roughly $5 trillion of support to multiple sectors of the economy. The removal of these expansionary programs, together with the Federal Reserve’s recent inflation-fighting move to raise interest rates, are having a tremendous contractionary impact on the economy, corporate profits, and stock prices.
While an economic recession has not been formally declared, we believe there is a better than even chance that we are already in one. First quarter real (inflation-adjusted) GDP contracted 1.6%. The Atlanta Fed’s GDP Tracker is now predicting a 1.9% decline in the second quarter. If this forecast proves accurate, which seems likely given the now persistently high levels of inflation, sagging consumer confidence, and higher interest rates, then we have met the commonly accepted, two quarter-decline definition of a recession. Stock prices, typically a leading indicator of economic downturns, have already suggested as much, recently falling into bear market territory.
Fortunately, there are good reasons to believe that any recession we encounter today will not be severe. Jobs are plentiful – the unemployment rate remains a low 3.6%, and there are almost two jobs open for every person who is unemployed. Thanks to rising home prices and relatively low debt levels, consumer balance sheets are in solid shape. Inventory levels, particularly in cyclical sectors like autos and housing, are not extended.

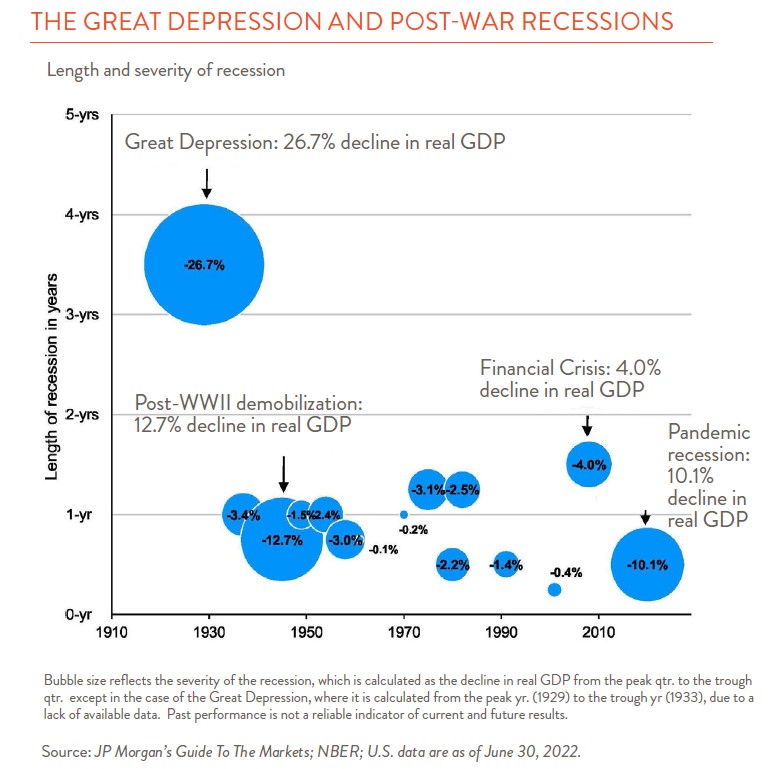
A look back in history can also prove useful (see chart left). There have been 15 recessions since 1910. All but one of them lasted less than two years, and the average economic decline (excluding the Great Depression) was 3.4%. Because available data is always backward looking, we may already be well through any downturn.
What does all this imply for stocks? At the risk of making a short-term market prediction (something we typically avoid), there are several reasons to believe that we are not quite done with this stock price sell-off. First, while stocks are now more reasonably priced than they were at the beginning of the year, they are still not cheap. As of June 30th, the S&P 500 traded at 15.9x this year’s consensus earnings estimates compared to an historic average of 16.4x. As a group, large-cap growth stocks in particular still appear fully valued when compared to historic levels. Second, analysts’ 2022 earnings estimates remain robust; on average they expect 11% year-on-year profit growth in the second half of the year. This rate of increase will be difficult to achieve in an environment where margins are being squeezed by higher interest rates, commodity prices, and labor costs. It’s hard to imagine stock prices making much headway when earnings estimates are still coming down.
But pockets of opportunity are beginning to appear. International shares, which have long underperformed their U.S. counterparts, in particular look overly discounted. And for those with a long time horizon, today’s prices look far better than they did six months ago.