
“In the short run, the market is a voting machine…but in the long run, the market is a weighing machine.”
—Benjamin Graham, as quoted by Warren Buffett
How long can the market keep moving up? This is one of the most common questions we get these days, and for good reason. Over the past three years, the S&P 500 has produced an average annual total return of just over 23%. While we have seen strings of strong returns before, this rate is more than double the 10% average stocks have provided over the long term.
What seems particularly confounding is that these gains have occurred amid so many economic and political headwinds. While each of us will have our own list, mine is topped by rising interest rates. Higher rates can dent corporate profits by making borrowing to fund inventories, expand production, and increase payroll more expensive. Higher bond yields also make bonds more attractive relative to stocks. Why accept the risk of owning stocks, you might ask, if government bonds yield over 5% and even your money-market fund is paying a nice, comfortable 3%–4%?
Companies and consumers also face inflationary pressures from rising fuel costs and higher tariffs. Finally, and perhaps most puzzling, is the mood among U.S. consumers. As the chart below shows, consumer sentiment is now below the lows reached during the 2008 financial crisis. How can the outlook for corporate profitability, and by extension the markets, be so bright when consumers, whose spending typically drives roughly two-thirds of economic activity, are so in the doldrums?
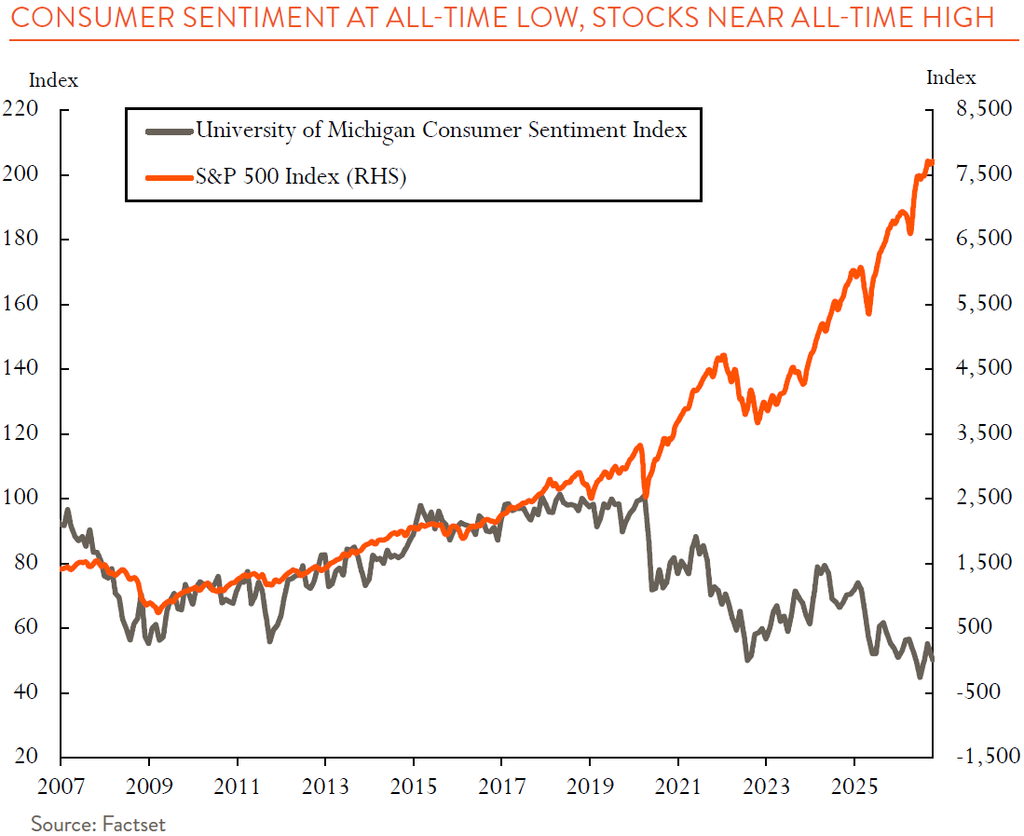
While stock prices can behave irrationally over shorter periods, there are good reasons for the market’s strength today. At the most basic level, two factors drive stock prices: 1) the level of (and rate of change in) corporate earnings, and; 2) the valuation that investors place on those earnings. Let us examine where both measures stand today.
From 2022 to 2025, S&P 500 company earnings grew at a 12.6% average annual rate—more than twice the 5%–6% long-term historical average. A look into the earnings of constituent companies reveals the source of these gains. Over the period, the tech and AI-focused “Magnificent 7” (i.e., Apple, Amazon, Alphabet, Nvidia and the like) grew earnings by just over 30% annually while earnings growth for the rest of the market came in at an anemic 3% rate (see chart below). This year, S&P 500 earnings are expected to expand by more than 30%, according to J.P. Morgan.
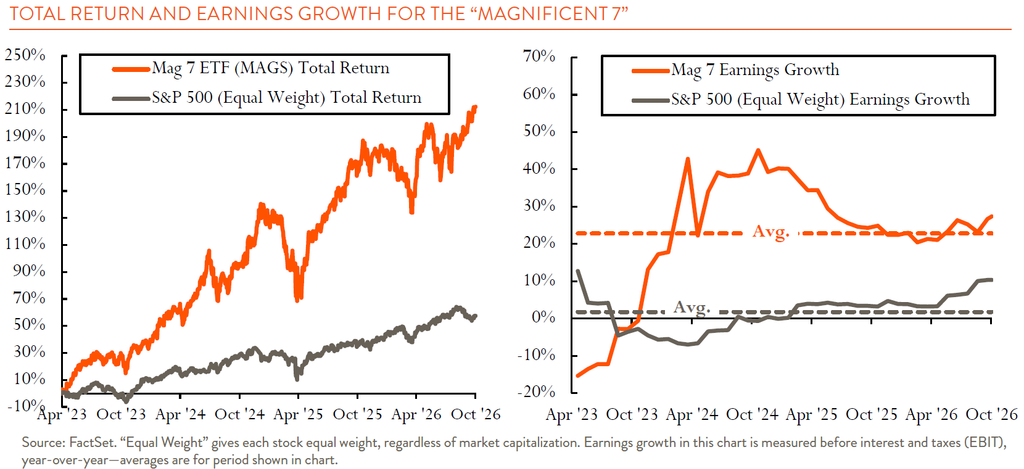
While AI-related companies are doing most of the heavy lifting, other forces are contributing as well. Higher oil and commodity prices are fueling profits at energy and basic materials firms. And despite weak consumer sentiment, consumers are still spending. The two aren’t necessarily at odds. Surveys capture attitudes across the income spectrum, but higher-income households do the bulk of spending. Many have benefited from rising stock and real estate prices, creating a “wealth effect” that helps sustain consumption even as the broader mood remains depressed.
So, what about valuations? The price-to-earnings (P/E) ratio measures what investors are willing to pay for corporate earnings and reflects, among other factors, investor sentiment or how optimistic or pessimistic they feel. At the end of the third quarter, the S&P 500 traded at 19x expected earnings, slightly above its 17x long-term average. A year ago, that multiple was around 23x. While this metric suggests that valuations are not particularly stretched, there are a few caveats to keep in mind.
First, the larger, growthier corners of the market (largely technology-related) are trading 10%–35% above their 20-year average P/E levels, according to J.P. Morgan. The strong outperformance of these firms has left broad market benchmarks highly concentrated. Consider that the top ten largest companies in the S&P 500 index today represent a record high 40% of its total value. Any stumble in the outlook for these firms will have a disproportionate impact on the market at large.
Second, what we are willing to pay for expected earnings depends on our confidence in those estimates, and earnings visibility today is particularly murky. The uncertain outlook for AI-related spending levels rightfully tops the list of investors’ concerns. The current rate of spending will inevitably slow, but how and when this occurs is anyone’s guess. Supply chain bottlenecks, safety concerns, or regulatory issues could force a pullback in spending, while rising costs could make customers more careful about how they incorporate these tools into their workflows.
What is the average investor to do in the face of this uncertainty? The best advice is to resist the temptation to sidestep a downturn by jumping into and out of the market. That approach requires getting two decisions right: when to get out and when to get back in. As much academic research has shown, the odds of success in this endeavor are slim.
The better strategy is to understand your investment horizon (when you need access to your funds) and your own risk tolerance. How much pain (read: losses) can you endure before being tempted to sell? With this information in hand, you can develop a mix of stocks, bonds, and cash that lets you sleep at night while also seeking a return that suits your goals.
We began this article with one quote, and we’ll end it with another.
“Knowing yourself is the beginning of all wisdom.”
—Aristotle
