
One of our main tasks as financial advisors is to answer the question, “What can I spend from my investment accounts in retirement?”
There are many variables that factor in—your age at retirement, asset allocation, financial market returns, and when you might file for Social Security, to name a few. And there are some familiar rules of thumb, like the 4% withdrawal rule, that look to collapse all that down into a simple answer. However, in practice, determining an approach to sustainable spending can be more nuanced. As advisors, we love nuance and spend a lot of time thinking about it! At the risk of getting a bit technical, we thought we’d take a look under the hood of the retirement planning process.
First, let’s understand how spending typically changes over the course of retirement.
Each retirement is different, but, for many people, spending often shifts through a few distinct phases (popularized by financial planner Michael Stein in The Prosperous Retirement):
- The “Go-Go” years—retirees are usually still healthy and active and spend more on travel, entertainment, and hobbies. They may also be paying down a remaining mortgage balance.
- The “Slow-Go” years—activity levels and travel often decrease with age, reducing spending on travel, entertainment, and hobbies. Mortgages may be paid off and living expenses become more predictable.
- The “No-Go” years—healthcare and potential long-term care needs become more prominent and can push spending higher, sometimes sharply.
These changing pressures help explain the “Retirement Smile” (coined by researcher David Blanchett), or vaguely “U-shaped” pattern. But that doesn’t mean portfolio withdrawals necessarily follow the same pattern, since other forms of retirement income play a role. In the early years of retirement, for example, individuals may delay filing for Social Security to increase their monthly benefits. That can mean higher portfolio withdrawals initially. At the same time, retirees might still work part-time during the Go-Go years, which can offset the need for withdrawals. When we combine changing spending needs with the staggered start of retirement income, portfolio withdrawals can end up looking like a hatchet—the “Retirement Distribution Hatchet” (described by Derek Tharp and Justin Fitzpatrick on Kitces.com), illustrated in orange in the chart below.
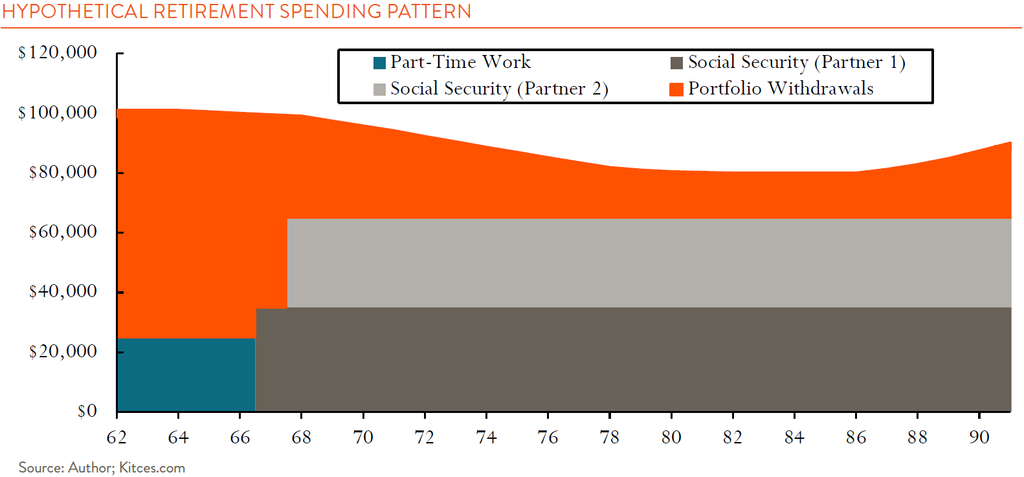
So that’s the general pressure an investment portfolio might feel in retirement. And while it’s great to have a sense of how spending varies over time, it doesn’t neatly match rules of thumb like the 4% rule, which sets an initial dollar withdrawal and then increases it with inflation. Nor does a spending pattern tell us what happens if the market decides to misbehave. So how do we account for both?
Financial planners and advisors commonly use software to model these more realistic, uneven spending patterns. This involves entering clients’ spending goals, retirement income, investment assets, and asset allocation, along with assumptions about lifespan, taxes, inflation, and investment returns. In essence, we map out the hatchet—or whatever tool (a saw?) your particular retirement goals might resemble. The planning software then runs 1,000 scenarios with different sequences of market returns, some bad and some good, and calculates how many leave enough money to fund the retiree’s goals throughout the planning period. This is called Monte Carlo simulation, and its “probability of success” is simply those successful trials as a percentage of the total. Advisors can then solve for a comfortable probability of success, say 80%, by adjusting portfolio income and spending needs.
Monte Carlo gets us much closer to a useful retirement plan. But the analysis isn’t dynamic, those scenarios assume the retiree sticks to the planned spending path regardless of what markets do. That leaves out one of the main things individuals can control each year: how much they spend. You thought we were already in the weeds? Enter the “guardrails.”
Jonathan Guyton and William Klinger (“G-K” from now on) proposed a set of retirement spending rules they dubbed “financial guardrails,” in a 2006 Journal of Financial Planning article. Similar to the 4% rule, G-K starts with an initial withdrawal amount. For illustration, that might be $4,200 a month from a $1 million portfolio—a 5.0% annual withdrawal rate. Withdrawals generally rise with inflation, but G-K adds rules for maintaining or adjusting them. Instead of committing to one spending path from the outset, the retiree cuts withdrawals if they become too large a share of the portfolio’s value, and increases them if they become sufficiently small. Simply put, a large enough market decline can trigger a cut, while strong gains can permit a raise (see figure below).
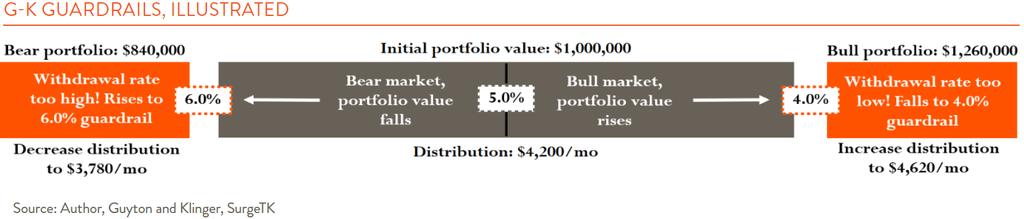
This dynamic approach can support higher initial withdrawal rates and greater overall retirement spending in modeled scenarios because making cuts in difficult periods prevents selling assets in down markets. The tradeoff is that it requires a willingness and ability to adjust spending, sometimes accepting lower income for an extended period.
And that flexibility is the real crux of it. We never know what the market will throw at us or deliver in terms of returns. The whole exercise of financial planning offers guidance, not certainty, because reality rarely unfolds according to the neat assumptions we enter into a software program. An asset allocation, across stocks, bonds, and cash, tailored to an individual’s investment objectives and risk tolerance can help us weather many storms. But the willingness and ability to adjust our spending and, if necessary, our lifestyles, may be the most powerful hedge we have against bad states of the world.
So, “What can I spend in retirement?” So much of any recommendation depends on the nuance of individual situations. While we can’t offer a pat answer, we can endorse a process for arriving at reasonable guidelines. Our obvious bias is to seek the help of a trusted advisor, one who can choose among these tools and help adapt the plan as circumstances change.
